தலைப்புகள்
ஆராயுங்கள்
Featured Insight
Sri Lanka in South Asia: 2nd in GDP, 5th in government revenue share
Sri Lanka lifted its government revenue to 13.5 per cent of GDP in 2024, the highest level in more than a decade. Yet, it still trails most South Asian neighbours in terms of government revenue. Academic research indicates a strong correlation between a country's national income and the level of taxes it collects. Richer states collect a larger share of GDP as taxes. France and Denmark, for instance, channel nearly half of their national output into government revenue. Sri Lanka has not followed this path. Over the years, its revenue ratio declined even as its per capita GDP increased, reaching a record low of 8.3 per cent of GDP in 2021. An IMF-backed fiscal consolidation program has since clawed back more than five percentage points in the revenue level, but the ratio remains low by regional standards. Among South Asian economies—already the world’s least taxed region—only Bangladesh and Pakistan collect less in terms of revenue to GDP. India, Nepal, Bhutan, and the Maldives all hover at, or above, 20 per cent. The mismatch is striking because Sri Lanka enjoys the region’s second-highest GDP per capita—about USD 4,516 in 2024, second only to the Maldives—yet falls to fifth place in terms of its revenue share.
தரவுத்தொகுப்புகள்
அறிக்கைகள்
சட்டங்கள் மற்றும் வர்த்தமானிகள்
விரிவான பார்வை
டாஷ்போர்ட
Annual Budget Dashboard
வரவு செலவுத்திட்ட வாக்குறுதிகள்
Fiscal Indicators
எரிபொருள் விலை கண்காணிப்பான்
IMF கண்காணிப்பான்
உட்கட்டமைப்பு கருத்திட்ட கண்காணிப்பான்
PF வயர்
எங்களை பற்றி
TA
English
සිංහල
தமிழ்
;
Thank You
ஜெனரல்
-
முகப்பு
விரிவான பார்வை
All
விவசாயம் மற்றும் நீர்ப்பாசனம்
Articles
பட்ஜெட் 2021
பட்ஜெட் 2022
பட்ஜெட் 2023
பட்ஜெட் 2024
Budget 2025
சிவில் நிர்வாகம்
கடன்
பாதுகாப்பு மற்றும் பொது ஒழுங்கு
கல்வி
ஊழியர் சேமலாப நிதியம்
வலு மற்றும் நீர் வழங்கல்
சுற்றுச்சூழல்
செலவினம்
நிதியளிப்பு
சுகாதாரம்
International Monetary Fund
Maldives
வருமானம்
சமூக பாதுகாப்பு மற்றும் நலன்புரி
போக்குவரத்து மற்றும் தொடர்பாடல்
நகர அபிவிருத்தி மற்றும் வீட்டுவசதி
Tags
வரவு செலவுத் திட்டம்
All
செயற்பாட்டுத் திட்டம்
உண்மையான
ஆண்டறிக்கை
ஒதுக்கீட்டு சட்டமூலம்
சொத்து முகாமைத்துவம்
கணக்காய்வு
வங்கி
முறிகள்
வரவு செலவுத் திட்டம்
இலங்கை மத்திய வாங்கி
இழப்பீடு
அரசாங்க நிதி பற்றிய குழு
தாபனம்
கொவிட்
சுங்க தீர்வை
சுங்கம்
கடன் முகாமைத்துவம்
கடன்
பற்றாக்குறை நிதியளிப்பு
அபிவிருத்தி
பேரழிவு
தேர்தல்கள்
ஊழியர் சேமலாப நிதியம்
வேலைவாய்ப்பு
ஊழியர் சேமலாப நிதியம்
பொருளாதார சேவைகள் கட்டணம்
மதிப்பீடு
கலால் வரி
வரவு செலவுத் திட்டம்
வெளிநாட்டுப் படுகடன்
நிதிச் சட்டம்
நிதியளிப்பு
இறைக்கொள்கை
சூதாட்ட வரி
வர்த்தமானி
மானியம்
சுகாதாரம்
சர்வதேச நாணய நிதியம்
வருமான வரி
கடன்
பேரினப்பொருளாதாரம்
நிதி அமைச்சு
மோட்டார் வாகனங்கள்
தேசிய மதிப்பீட்டுக் கொள்கை
தேச கட்டுமான வரி
துறைமுக மற்றும் விமான நிலைய அபிவிருத்தி அறவீடு
பாராளுமன்றம்
செயலாற்றுகை அறிக்கை
கொள்முதல்
முன்னேற்ற அறிக்கைகள்
செயற்திட்ட முன்னேற்றம்
மாகாண சபை வரவு செலவுத் திட்டம்
அரச நிதி
ஊதியம்
ஒதுக்குகள்
வருமானம்
மோசடிகள்
சிறப்பு பண்டத் தீர்வை
அரசுடமைத் தொழில்முயற்சிகள்
முத்திரை வரி
அரசுடமைத் தொழில்முயற்சிகள்
வரி விலக்குகள்
வரிச் சலுகைகள்
வரிச் சீர்திருத்தங்கள்
வரி வருமானம்
வரி
தொலைத் தொடர்பாடல் அறவீடு
புகையிலை
பெறுமதி சேர் வரி
vote on account
தரவுத்தொகுப்புகள்
அறிக்கைகள்
சட்டங்கள் மற்றும் வர்த்தமானிகள்
விரிவான பார்வை
வருடாந்தமாக தேர்வு செய்ய
இருந்து
1977
1978
1979
1980
1981
1982
1983
1984
1985
1986
1987
1988
1989
1990
1991
1992
1993
1994
1995
1996
1997
1998
1999
2000
2001
2002
2003
2004
2005
2006
2007
2008
2009
2010
2011
2012
2013
2014
2015
2016
2017
2018
2019
2020
2021
2022
2023
2024
2025
செய்ய
1977
1978
1979
1980
1981
1982
1983
1984
1985
1986
1987
1988
1989
1990
1991
1992
1993
1994
1995
1996
1997
1998
1999
2000
2001
2002
2003
2004
2005
2006
2007
2008
2009
2010
2011
2012
2013
2014
2015
2016
2017
2018
2019
2020
2021
2022
2023
2024
2025
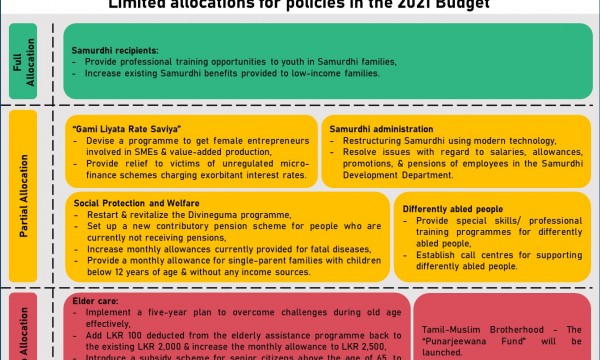
Has the Government Fulfilled its Policy promises in the Social Empowerment Sector Through the 2021 Budget?
The National Policy Framework: Vistas of Prosperity and Splendour is the government’s official policy document. As such, the government is bound to implement the policies mentioned in this policy document. For the majority of...
2021-04-05
நுண்ணறிவைக் காண்க
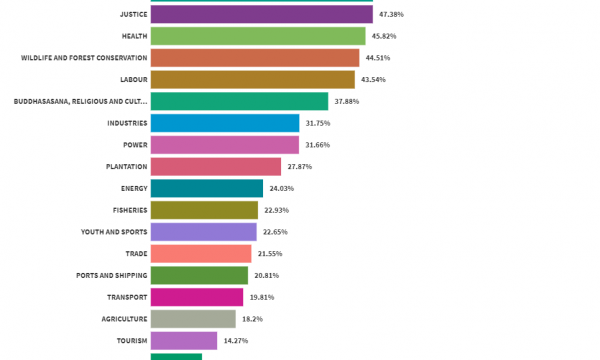
Personal Emoluments as a Share of Total Expenditure
The chart below provides a sectoral breakdown of the total government budgeted expenditure on Personal Emoluments, including salaries and wages, overtime and holiday payments and other allowances. The sectoral breakdown was calculated based on the detailed budget...
2021-04-02
நுண்ணறிவைக் காண்க
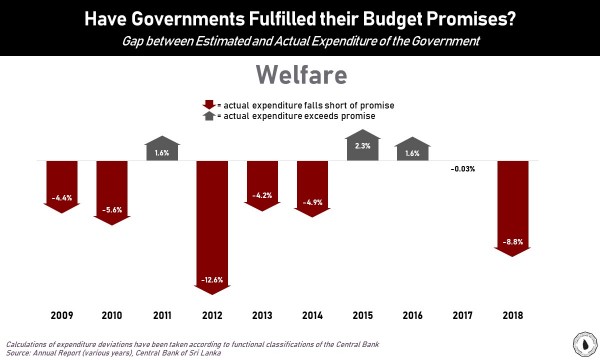
Have Governments Fulfilled their Welfare-related Budget Promises?
Have consecutive governments stuck to their budget promises? In the past, governments have displayed deviations to their expenditure commitments. Here is a snapshot showing the dev...
2020-10-14
நுண்ணறிவைக் காண்க